
Executive KPIs
KPI dashboard Data Studio builds for leadership teams
Our KPI dashboard Data Studio builds give a leadership team one page that shows how the business is doing against target, with a click through to the department view behind every number. They are for owners, MDs and operating heads who currently read five departmental reports and still cannot see the whole company at once.
Quick answer
How do you build a KPI dashboard in Data Studio for leadership?
A KPI dashboard in Data Studio for leadership starts with eight to twelve agreed metrics, each with a target, an owner and one source. Those metrics sit on a single page as scorecards against target, and each one links to a detail page. A good KPI dashboard Data Studio build keeps the top page fixed and the drill-through flexible.
- Leadership agrees eight to twelve KPIs, each with one owner, target and source.
- Targets live in a sheet, so changing a goal never means editing charts.
- Every scorecard links through to the department page that explains it.
- Conditional colors show at a glance which numbers need attention this week.
What makes a good KPI dashboard Data Studio one-pager?
A good one-pager answers "are we on track?" in under a minute. It shows a small, fixed set of metrics, each against its target and its trend, with color only where something needs attention.
Leadership pages fail when they try to hold everything. We push back on adding a fourteenth scorecard, because the page stops being read. Detail belongs on the pages beneath, one per function, where department heads can go as deep as they need.
- Commercial: revenue, new customers, pipeline coverage, win rate.
- Operations: on-time delivery, output, utilization, backlog.
- Finance: gross margin, cash, receivables over 60 days.
- People: headcount against plan, attrition.
How do you show targets vs actual in Data Studio?
We store targets in a Google Sheet by month and metric, then join them to actuals so every scorecard and chart can show both. Finance or the KPI owner edits the sheet when a target changes, and the dashboard follows.
Scorecards show actual, target and percent to target, with conditional formatting for on track, at risk and behind. Bullet charts work well for monthly progress, and a line chart with a target series shows whether the gap is closing. Where a target is cumulative, such as year-to-date revenue, the calculated field accumulates both series the same way, so the comparison is fair on day ten as well as day thirty.
What you get
What we build
Scoped and quoted at a fixed price after a free review.
KPI definitions
A signed-off list of metrics with formula, source, owner and target for each.
Target sheet
Monthly targets by metric in a Google Sheet that owners can update.
Leadership page
One page of scorecards and trends against target, color-coded by status.
Department pages
Drill-through pages for sales, operations, finance and people.
Data model
One table per period and metric in Sheets or BigQuery, fed from each source.
Delivery
Weekly scheduled email of the summary, plus alerts on Pro where wanted.
How does drill-through work from the summary page?
Each scorecard on the summary links to the page that explains it, and filters carry across. A leader who sees on-time delivery slipping clicks through to the operations page already filtered to the same period and region.
We use report-level filter controls so date and region selections persist between pages, cross-filtering so clicking a bar in one chart filters the others, and drill-down on dimensions such as region to site to line. Cross-data-source filtering, added in January 2026, lets one control filter charts that read from different sources, which used to need workarounds.
Where does the data for an executive dashboard come from?
It comes from each department's own system, brought into one model. Sales data from the CRM, operations data from production or logistics systems, finance data from accounting exports and HR data from a headcount sheet.
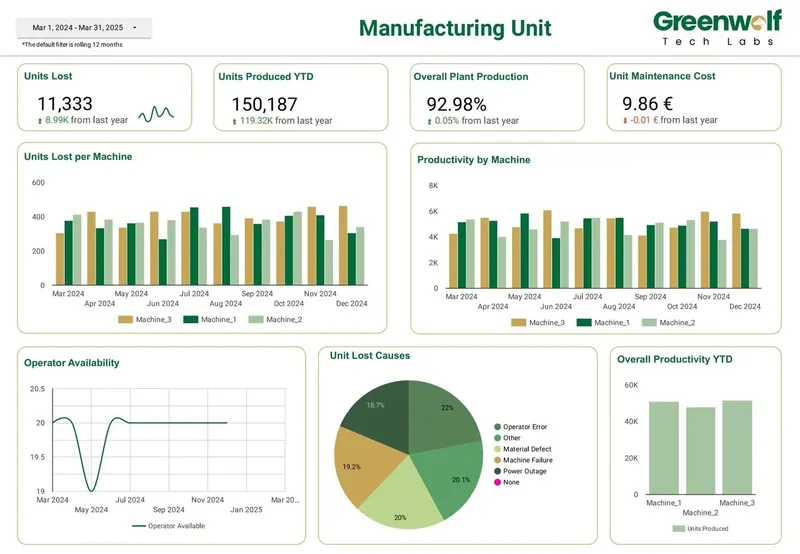
Pulling five systems into one page is beyond what a blend handles well, since blends join at most 5 sources and only on equal keys. For most leadership dashboards we build a small model in Google Sheets or BigQuery with one row per metric per period, which makes the summary page fast and every number traceable. The manufacturing dashboard we built, tracking units produced and lost, productivity per machine and maintenance cost, is a typical example of a department page that feeds a leadership view.
How do you get a leadership team to agree on KPIs?
We run a short definitions workshop before building anything. For each proposed KPI we write down the exact formula, the source system, the owner, the target and how often it changes.
This is usually where the real work is. Two departments often define "active customer" or "on time" differently, and the dashboard cannot settle that on its own. Once definitions are agreed and signed off, they appear in the report as info text next to each metric, so a new manager reads the same definition the leadership team agreed.
A KPI dashboard Data Studio project that skips this step tends to be rebuilt within a year. One that starts with agreed definitions usually only needs new targets each financial year.
How is the dashboard delivered to busy executives?
Most executives get it in their inbox. A scheduled email sends the summary page as a PDF and link every Monday morning, and the full report is there when they want the detail.
On Data Studio Pro, schedules can run hourly and deliver to Slack or Google Chat, and alerts can notify an owner when a metric crosses a threshold. Viewers do not need a Pro licence, so the leadership team reads the dashboard at no extra licence cost.
Why do executive dashboards stop being used?
They usually stop being used because one number was wrong once and nobody trusted the rest. The second most common reason is that the page grew until it answered every question badly.
We guard against both. Every KPI is checked against its source before launch by a second analyst, and the summary page shows the date each source last loaded, so stale data is visible rather than silent. A change request process sends new metrics to department pages by default, and only a leadership decision promotes one to the summary.
We also design for the way executives actually read: the page fits a laptop screen without scrolling, numbers are rounded to what matters for a decision, and comparisons are always to target first, then to last period. Small details, but they decide whether the report is opened on Monday or ignored.
How it works
How a project runs
- 01
Free review
We look at your current reports and systems and who will use the dashboard.
- 02
Definitions workshop
Leadership agrees the KPIs, formulas, owners and targets.
- 03
Model
We connect each source and build the metric table.
- 04
Build and QA
We build the summary and drill-through pages, then check every KPI against its source.
- 05
Rollout
We set schedules and access and walk the leadership team through it.
FAQ
Frequently asked questions
How many KPIs should an executive dashboard have?
Usually eight to twelve on the summary page. More than that and the page stops being read, so extra metrics go on department pages one click away.
Can Data Studio show KPIs against targets?
Yes. Targets kept in a Google Sheet can be joined to actuals by month and metric, then shown in scorecards, bullet charts and line charts with conditional formatting.
Can I drill from a KPI to the detail behind it?
Yes. We link each scorecard to a department page, keep filters at report level so selections carry over, and use drill-down on dimensions such as region and site.
Can a KPI dashboard combine data from different systems?
Yes. We bring CRM, operations, finance and HR data into one model in Sheets or BigQuery, which is more reliable than chaining blends across many sources.
Do executives need a Data Studio licence to view the dashboard?
No. Data Studio is free to view, and on Data Studio Pro only creators, editors and managers need licences.
How often should an executive KPI dashboard update?
Weekly is enough for most leadership metrics, with finance figures following month-end close. Operational sources can refresh daily, and each section shows when its data last loaded.
What does a KPI dashboard cost?
We quote a fixed price after a free review. It depends mostly on how many source systems feed the KPIs and how clean their data is.
Keep reading
Related pages
Get started
Tell us what your reporting has to do
Describe the dashboards you need, who reads them and where the data sits. We reply within one business day with an approach, the connectors involved and a fixed-price plan.
- Free 30-minute reporting review
- Fixed quote before any work starts
- Everything built and owned in your Google account
Prefer email? info@greenwolftechlabs.com
Get a free proposal
Two lines is enough to start.