
Pharma and healthcare
Data Studio pharma dashboards for brand and commercial teams
A pharma dashboard in Data Studio brings syndicated prescription data, Veeva CRM call activity, specialty pharmacy and hub feeds and the brand forecast into one report that brand managers and field leaders can both use. We build them for commercial operations, brand and sales teams at pharmaceutical and healthcare companies. Reports use aggregated data only, with territory-level access so each rep and manager sees their own geography.
Quick answer
What does a pharma brand performance dashboard include?
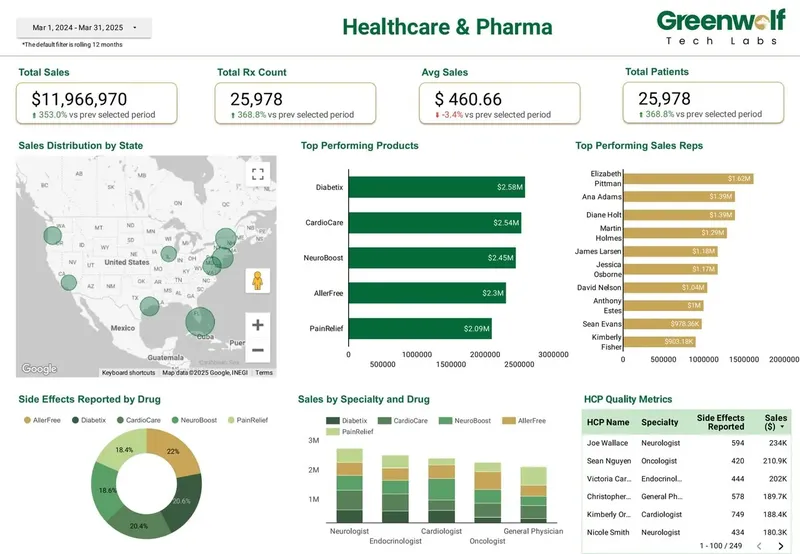
A pharma dashboard for brand performance includes sales and prescription (Rx) volume over time, product performance, sales by state on a map, top reps, HCP metrics such as prescribers reached and called on, and actual versus forecast by product. It is built on aggregated data, refreshed as each source updates, and filtered by territory for the field.
- Our brand build shows Rx volume, product performance, state map, top reps, HCP metrics and forecast variance.
- Rx data, Veeva calls, specialty pharmacy and hub feeds are aligned to one product and territory hierarchy.
- Reports carry aggregated counts only; no patient-level records reach a Data Studio page.
- Our director began his career at ZS in pharmaceutical commercial operations.
What does a pharma dashboard show a brand team?
It shows whether the brand is on plan and where the gap is. The pharma dashboard we built in Data Studio for a healthcare and pharma client covers brand performance on one set of pages, starting with the headline and drilling to state, product and rep.
The views are the ones a brand lead asks for before a quarterly business review, arranged so the national picture comes first and the field detail second.
- Sales and prescription (Rx) volume by week or month.
- Product performance across the portfolio and by strength or pack where the data allows.
- Sales by state on a filled map.
- Top reps ranked on the agreed measure.
- HCP metrics: prescribers reached, called on and writing.
- Actual versus forecast by product, with the variance highlighted.
Which data sources feed a commercial pharma report?
Usually four or five, each with its own refresh rhythm and its own idea of a territory. Syndicated prescription data from the large data vendors arrives weekly or monthly at prescriber or geography level. Veeva CRM holds call activity, samples and HCP targeting. Specialty pharmacy and hub data adds dispense, referral and patient start counts for specialty brands. Finance supplies ex-factory sales and the forecast.
Aligning them is the real work. We build one product hierarchy, one HCP master keyed on the identifier your data uses, and one territory alignment table, then join everything in BigQuery or a governed Google Sheet. Data Studio blends cap at five sources with equality joins only, which is not enough for a full commercial model, so the joins happen upstream.
We also plan for restatements. Syndicated vendors often revise recent weeks, so the pipeline reloads a rolling window rather than appending, and the report shows the data-through date on every page.
What you get
What we build
Scoped and quoted at a fixed price after a free review.
Brand overview
Sales and Rx volume trend with the data-through date, product and period filters.
Product performance page
Each product's volume and share of portfolio, by month and by state.
Geographic map view
Sales by state on a filled map, with drill to territory for authorized viewers.
Field performance page
Top reps and HCP metrics such as prescribers reached and called on, from Veeva CRM call activity.
Forecast versus actual
Variance by product against a selectable forecast version, with tolerance flags.
Territory access setup
Row-level filtering by viewer email tied to your alignment table, tested at each level.
Data alignment layer
Product hierarchy, HCP master and territory tables that join Rx, CRM, hub and finance data.
How do you keep patient privacy out of the dashboard?
By never bringing patient-level records into the reporting layer. The pages show aggregated counts, such as prescriptions by prescriber, by state or by week, and hub or specialty pharmacy figures arrive already summarized. Small-cell counts can be suppressed or grouped where your policy calls for it.
Healthcare data is subject to privacy rules such as HIPAA in the US and equivalents elsewhere. We work within the policies your compliance and legal teams set and follow their direction on what may be stored and shown. We are not lawyers and do not give legal or regulatory advice.
Can each rep see only their own territory?
Yes. Field reports usually need row-level access, so a rep sees their territory, a district manager sees their reps, and head office sees the nation. We do this with a data source filter on the viewer's email, matched to the alignment table, or with BigQuery row-level policies for larger teams.
Credentials matter here. Viewer's credentials make Data Studio check each person's own access to the data, while owner's credentials show the report as the owner sees it, so the filter has to be in place before a field-wide link goes out. We test with real accounts from each level before launch.
How should forecast versus actual be shown?
As variance against a forecast that is versioned and dated. Brand teams reforecast during the year, so a single forecast column loses the history of what was promised. We store each forecast version and let the viewer pick the comparison with a parameter, so the original budget and the latest reforecast are both a click away.
Variance is shown by product, by month and by state, with calculated fields that flag where actual falls outside a tolerance you choose. That turns the page into a list of conversations for the next field meeting.
Why does pharma commercial experience matter for a pharma dashboard?
Because the hard questions are about the business, not the charts. Harsh Khubchandani, our Director of Automation and Analytics, began his career at ZS in pharmaceutical commercial operations, and our team brings experience from top consulting firms. We know why a TRx trend and an NRx trend can point in opposite directions, why call plans and alignments change mid-cycle, and why a brand lead wants the data-through date in the corner of every page.
As a data studio agency, we pair that domain knowledge with the build work: modeling in BigQuery, report design in Data Studio and scheduled delivery of a PDF summary to leadership each week. On Data Studio Pro, content can be owned by your organization's Google Cloud project, with audit logging.
How it works
How a project runs
- 01
Free review
We review your current brand reports, data sources and access rules, then quote a fixed price.
- 02
Compliance check-in
We confirm with your compliance team which data may be stored and shown, and at what level of aggregation.
- 03
Alignment and model
We build the product, HCP and territory tables and load each source on its own schedule.
- 04
Build and validate
Pages are built and totals reconciled against vendor deliveries and finance figures.
- 05
Field launch
Access tested with real accounts at each level, then rolled out with short training for brand and field teams.
FAQ
Frequently asked questions
Can Data Studio handle prescription data from syndicated vendors?
Yes, once the files are loaded into BigQuery or another supported database. Data Studio has no native connector for those vendors, so we load each delivery into a table and the report reads from there. Weekly reloads cover any restated weeks.
Can a pharma dashboard pull call activity from Veeva CRM?
Yes. Call, sample and targeting data can be exported from Veeva CRM on a schedule and loaded into BigQuery. We join it to Rx data through an HCP master table so calls and prescribing appear on the same page.
Is patient data shown in the dashboard?
No. We build reports on aggregated data only, such as counts by prescriber, state or week. What may be stored and shown is set by your compliance team, and we do not give legal advice.
How do you restrict reps to their own territory in Data Studio?
We filter the data source by the viewer's email against your alignment table, or use BigQuery row-level policies. Each rep sees their territory and managers see the reps under them. We test every level before launch.
Can we compare actuals to more than one forecast?
Yes. Each forecast version is stored with its date, and a parameter on the page lets the viewer choose which one to compare against. Budget and latest reforecast can both be shown.
How often does a pharma brand dashboard refresh?
Each source refreshes on its own rhythm, often weekly for Rx data and daily for CRM activity. The report shows the data-through date for each so nobody mixes periods by accident.
Keep reading
Related pages
Get started
Tell us what your reporting has to do
Describe the dashboards you need, who reads them and where the data sits. We reply within one business day with an approach, the connectors involved and a fixed-price plan.
- Free 30-minute reporting review
- Fixed quote before any work starts
- Everything built and owned in your Google account
Prefer email? info@greenwolftechlabs.com
Get a free proposal
Two lines is enough to start.