
Manufacturing
Data Studio manufacturing dashboards for plant and operations heads
A manufacturing dashboard in Data Studio shows units produced and lost, which machines are losing them and why, and what maintenance is costing, using the MES, ERP and machine log data you already have. We build them for plant managers, operations heads and owners of growing manufacturing units who still compile shift reports by hand. The result is one view of the plant that the floor, maintenance and finance read the same way.
Quick answer
What KPIs belong on a manufacturing dashboard?
A manufacturing dashboard should show units produced and units lost, overall plant production, units lost per machine, productivity by machine, operator availability, the causes of unit loss and maintenance cost. Where machine logs record planned time and ideal cycle time, it can add availability, performance and quality, the three components behind OEE.
- Our plant build covers output, losses per machine, productivity, operator availability, loss causes and maintenance cost.
- Data comes from MES, ERP exports such as SAP Business One, Tally or NetSuite, and machine logs.
- OEE is only as good as the planned time and ideal cycle time behind it.
- Loss and downtime reasons are mapped to a short list so Pareto charts mean something.
What does our manufacturing dashboard show the plant team?
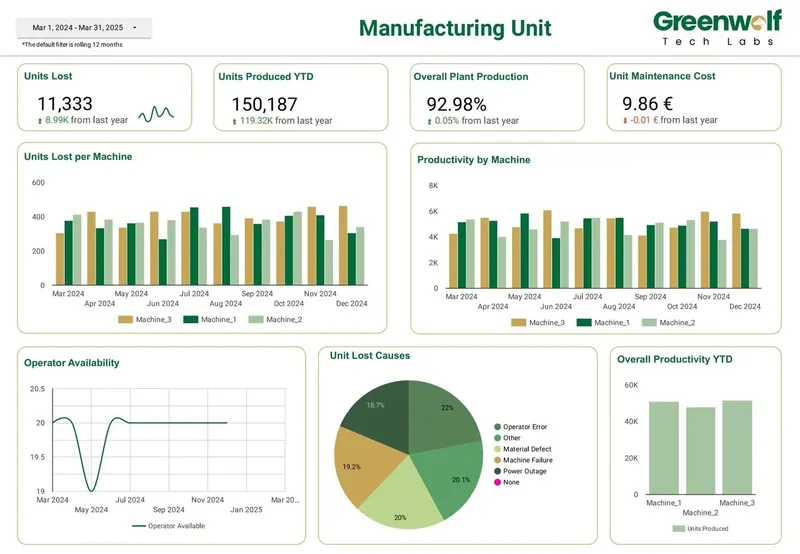
Output, losses and their causes, machine by machine. The manufacturing dashboard we built in Data Studio for a manufacturing unit starts with units produced against units lost and overall plant production, then moves to the machine level.
At machine level it shows units lost per machine and productivity by machine, so the worst performers are obvious. Operator availability sits alongside, because a machine standing idle for want of a trained operator is a different problem from one waiting on a spare part. A causes-of-loss chart and a maintenance cost view complete the picture.
Where does production data live in a typical plant?
Across more systems than most people expect. Production orders, receipts and stock movements sit in the ERP, often SAP Business One, Tally or NetSuite for growing manufacturers. Machine counts and stoppages come from an MES if you have one, from PLC or controller logs exported as CSV, or from shift sheets typed up by supervisors.
Maintenance work orders and spare parts may be in a separate CMMS or simply in a spreadsheet kept by the maintenance head. Attendance and shift rosters, needed for operator availability, often live in HR or payroll software.
We bring these into BigQuery or a set of governed Google Sheets, with a machine master table that gives every machine one ID across systems. Without that table, the ERP's work center, the MES's asset tag and the maintenance log's nickname for the same press never line up.
- ERP: production orders, good receipts, scrap postings, cost centers.
- MES or machine logs: counts, cycle times, stoppage start and end times.
- Maintenance: work orders, parts used, labour hours, vendor invoices.
- Shift and attendance: rostered versus present operators by line.
What you get
What we build
Scoped and quoted at a fixed price after a free review.
Plant production overview
Units produced, units lost and overall plant production by day, shift and line.
Machine performance page
Units lost per machine and productivity by machine, ranked so the worst performers stand out.
Operator availability view
Rostered versus present operators by line and shift, next to idle machine time.
Loss cause analysis
A Pareto of units lost by mapped cause, with an unmapped bucket kept visible.
Maintenance cost page
Parts, labour and outside service cost per machine by month, set beside losses.
OEE components
Availability, performance and quality as separate fields, built only where the inputs exist.
Machine master and mappings
One ID per machine across ERP, MES and maintenance, plus the reason code mapping sheet.
Can a Data Studio report calculate OEE?
Yes, if the inputs exist, and we are careful to say when they do not. OEE multiplies three rates: availability (run time over planned production time), performance (ideal cycle time times total count, over run time) and quality (good count over total count). Each needs data many plants do not yet capture reliably.
If your machine logs have stoppage times but no ideal cycle time, we show availability and quality and leave performance out rather than guessing. We build each component as its own calculated field so supervisors can see which one is dragging the score down, and we never present a single OEE figure without its parts.
How should downtime and unit loss causes be classified?
Into a short, agreed list that operators can actually choose from. Free-text reasons like stuck, jam, waiting and no material are common in shift sheets and machine logs, and they make cause charts useless.
We map existing reasons into categories such as breakdown, changeover, material shortage, quality reject and operator unavailable, using a CASE statement or a mapping sheet the plant can edit. Unmapped reasons stay in their own bucket on the report so the list gets tidier each month. A Pareto chart of units lost by cause then points to the two or three issues worth a kaizen. Where a loss happens matters too, so each cause can be split by machine, shift and product, which often shows that one changeover on one line explains most of a category.
How do you track maintenance cost per machine?
By joining maintenance work orders and parts consumption to the machine master, then setting cost next to the losses each machine causes. A machine with high maintenance spend and low losses may be well looked after; one with high spend and high losses may be due for replacement.
Cost comes from the ERP or the maintenance log, split into parts, labour and outside service. We show it by month and by machine, with a filter for planned versus breakdown maintenance where your work orders record it. A rising share of breakdown work against planned work is an early sign that preventive schedules are slipping, and it is easy to see once both types sit on one chart.
Why work with an agency rather than build it in-house?
Mostly for the data plumbing. Charts are the quick part; mapping machine IDs, reason codes and ERP exports is where in-house projects stall. As a data studio agency with experience from top consulting firms, we have built this pattern before and can usually reuse the model.
We also set up scheduled delivery so a PDF of yesterday's production lands in the plant head's inbox before the morning meeting, and we keep blends under Data Studio's five-source limit by joining upstream. Plants with an old Looker Studio report keep it; the product was simply renamed back to Data Studio.
How it works
How a project runs
- 01
Free review
We look at your ERP exports, machine logs and shift reports, then quote a fixed price.
- 02
Plant walk-through
A session with production and maintenance to agree machines, reason codes and definitions.
- 03
Data model
Machine master, reason mapping and automated loads from each source into BigQuery or Sheets.
- 04
Build and check
Pages are built and output figures reconciled against ERP production receipts.
- 05
Floor rollout
Supervisors are shown how to read and update mappings, and daily delivery is switched on.
FAQ
Frequently asked questions
Can Data Studio connect to SAP Business One or Tally?
Not through a native connector. We schedule exports or database extracts into BigQuery or Google Sheets, and Data Studio reads from there. The right method depends on your version and hosting.
How do you calculate OEE in a dashboard?
OEE is availability times performance times quality. Each needs specific inputs: planned time, run time, ideal cycle time, total count and good count. We build each component separately and only show OEE when all three inputs are reliable.
Can machine logs be used without an MES?
Yes. Many controllers export counts and stoppage times as CSV, and those files can load into BigQuery on a schedule. Shift sheets can fill gaps until logging improves.
How do you show units lost per machine?
Each loss record is tied to a machine ID from the machine master and a mapped cause. The report ranks machines by units lost and lets you drill into causes for any one of them.
Can the plant head get a daily production report by email?
Yes. Data Studio scheduled delivery can email a PDF of chosen pages every morning. Data Studio Pro also supports hourly schedules and delivery to Slack or Google Chat.
What if our downtime reasons are free text?
We map existing free text into a short category list using a mapping sheet your team can edit. Unmapped entries are shown separately so the list improves over time.
Keep reading
Related pages
Get started
Tell us what your reporting has to do
Describe the dashboards you need, who reads them and where the data sits. We reply within one business day with an approach, the connectors involved and a fixed-price plan.
- Free 30-minute reporting review
- Fixed quote before any work starts
- Everything built and owned in your Google account
Prefer email? info@greenwolftechlabs.com
Get a free proposal
Two lines is enough to start.