
Insurance
Data Studio insurance dashboards for brokers and agencies
An insurance dashboard in Data Studio replaces the monthly ritual of pasting insurer spreadsheets and policy admin exports into one workbook. We build them for insurance brokers, agencies and scheme administrators who report membership, churn, renewals and commission across many insurers and client schemes. You get a report that refreshes from the files you already receive, with the business rules written down once.
Quick answer
What should an insurance broker's dashboard track?
An insurance dashboard for a broker should track members joined, exited and retained per client scheme, churn rate by client and customer type, upcoming renewals and commission by insurer. It should refresh from the policy administration export and insurer files rather than a hand-built spreadsheet, so the numbers are consistent each month and any member can be traced back.
- Our broker build tracks joined, exited and retained members and churn per client scheme.
- Insurer .xls files land in Google Drive, get mapped and feed the report.
- One Australian brokerage cut report time from 4-5 hours to under 5 minutes.
- Renewals and commission can sit beside churn once policy and statement data are mapped.
Which numbers does an insurance broker actually report each month?
For most brokers and agencies it comes down to four questions: how many members or policies each scheme gained and lost, why they left, what is coming up for renewal, and what commission each insurer owes. The answers live in different places, which is why month end takes so long.
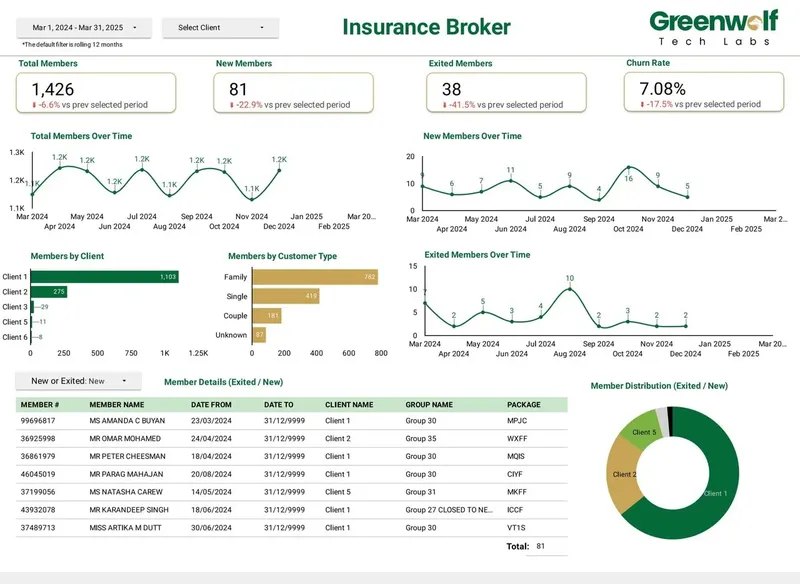
The insurance dashboard we built in Data Studio for a broker focuses on membership and churn per client scheme. It shows members joined, exited and retained, churn rate by client and by customer type, and a filterable member list so an account manager can see exactly who left a scheme and when.
Case study: how did an Australian brokerage get from hours to minutes?
An Australian insurance brokerage received messy .xls files from multiple insurers, each in its own layout. Someone on the team spent four to five hours rebuilding the report every cycle, and reporting accuracy sat at about 75%.
We automated the pipeline. Files now go to a Google Drive folder, are mapped into a central Google Sheet, have the brokerage's business rules applied, and feed the Data Studio report directly. Report time fell to under 5 minutes, accuracy rose to 99%, and visibility across insurers went from limited to real time, with filters.
What you get
What we build
Scoped and quoted at a fixed price after a free review.
Scheme membership overview
Members joined, exited and retained per client scheme, with month and insurer filters.
Churn analysis page
Churn rate by client and customer type, with the exit rules shown on the page.
Filterable member list
A searchable table of members by scheme, status and dates, shared only with the people who need it.
Renewals pipeline
Policies due in the next 30, 60 and 90 days by account manager and insurer.
Commission reconciliation
Expected versus received commission by insurer and month, with short-paid lines highlighted.
Insurer file pipeline
Drive folder, mapping sheet, business rules and exceptions list that turn insurer .xls files into one table.
How do you turn insurer bordereaux into one clean table?
By mapping every insurer's layout to one standard set of columns before anything reaches a chart. Bordereaux and statements arrive as .xls or .xlsx with merged header rows, totals mixed into data rows and dates stored as text. A Data Studio blend cannot fix that; it can join at most five sources and only on exact matches.
We build a mapping table per insurer that says which column means policy number, member ID, start date, end date, premium and commission. When an insurer changes its template, your team updates one row in the mapping sheet instead of calling us. Larger books, or ones with several years of history, go into BigQuery so the report stays quick.
- Standard columns: insurer, scheme, client, member or policy ID, customer type, start, end, status, premium, commission.
- Rules applied once: how a lapsed policy is counted, what makes a member retained, which date defines an exit.
- Exceptions sheet: rows that fail a rule are listed for review, not silently dropped.
How is churn per client scheme calculated in an insurance dashboard?
Churn rate is members exited in the period divided by members at the start of the period, calculated per scheme. The hard part is agreeing what counts as an exit. A member who moves between two of your schemes, or a policy cancelled and reissued on the same day, should not inflate churn.
We encode those rules in calculated fields, typically a CASE statement over status and dates, and show the definition on the page. Breaking churn by customer type then shows whether a scheme is losing its individual members, its family members or a whole employer group.
Can renewals and commission sit in the same report?
Yes, if the policy admin export carries renewal dates and the insurer statements carry commission lines. We add a renewals page that lists policies due in the next 30, 60 and 90 days by account manager, and a commission page that reconciles what each insurer paid against what the policy data says was due.
Commission reconciliation is where brokers can find missing money. When the expected and received figures sit side by side by insurer and month, an unpaid or short-paid line is visible without anyone building a pivot table. Clawbacks on cancelled policies get their own column, so a negative month is explained rather than queried.
Who should see member-level data?
Only the people who need it. The member list is useful to account managers and less appropriate for a board pack, so summary pages show counts and rates while the member-level page is shared with a smaller group. Where client schemes are run by different account teams, the data source can filter rows by the viewer's email so each team sees only its own schemes.
We set data source credentials deliberately, so viewers see the report without access to the underlying Drive folder, and we keep ownership on a shared account. Scheduled delivery can email a PDF summary to principals each month. As a data studio agency working with brokers, we follow your own privacy and data handling policies; we do not give legal or compliance advice.
Case study · Insurance brokerage, Australia
From 4-5 hours of spreadsheet work to a report in under 5 minutes
Monthly reports were assembled by hand from inconsistent .xls files sent by several insurers. The files now land in Google Drive, are mapped into one central sheet with the business rules applied, and feed a Data Studio dashboard.
- Report time: 4-5 hours to under 5 minutes
- Reporting accuracy: about 75% to 99%
- Visibility across insurers: limited to real time, with filters
How it works
How a project runs
- 01
Free review
Send us a sample of your insurer files and policy admin export. We map the gaps and quote a fixed price.
- 02
Rules agreed
We write down how joins, exits, retention and renewals are counted, and confirm them with you.
- 03
Pipeline built
Insurer files and exports flow from Google Drive into a mapped central sheet or BigQuery.
- 04
Report and reconcile
We build the pages and check totals against last month's manual report line by line.
- 05
Handover
Your team learns how to add a new insurer layout and where the exceptions list lives.
FAQ
Frequently asked questions
Can Data Studio read insurer bordereaux in .xls format?
Not reliably on its own, because .xls files with merged headers and totals rows do not load cleanly. We send them through Google Drive into a mapped Google Sheet or BigQuery table first. Data Studio then reads that clean table.
How do you calculate member churn for an insurance scheme?
Churn is members who exited during the period divided by members at the start of it, per scheme. Transfers between schemes and same-day reissues are excluded by rule. The definition is shown on the dashboard so everyone reads it the same way.
How long does it take to automate broker reporting?
It depends on how many insurers and file layouts you have. After a free review we give you a fixed price and timeline. One Australian brokerage went from 4-5 hours per report to under 5 minutes once the pipeline was live.
What happens when an insurer changes its spreadsheet layout?
Rows that no longer match the mapping go to an exceptions list instead of breaking the report. Your team updates the mapping sheet for that insurer, and the next refresh picks up the change.
Can we keep member names out of the summary report?
Yes. Summary pages show counts and rates only, and the member-level list sits on a page or report shared with a smaller group. Access follows your internal privacy policy.
Does this work with our existing Looker Studio report?
Yes. Looker Studio is now called Data Studio again, and existing reports moved over automatically. We can rebuild the data underneath and keep the report your team already knows.
Keep reading
Related pages
Get started
Tell us what your reporting has to do
Describe the dashboards you need, who reads them and where the data sits. We reply within one business day with an approach, the connectors involved and a fixed-price plan.
- Free 30-minute reporting review
- Fixed quote before any work starts
- Everything built and owned in your Google account
Prefer email? info@greenwolftechlabs.com
Get a free proposal
Two lines is enough to start.